
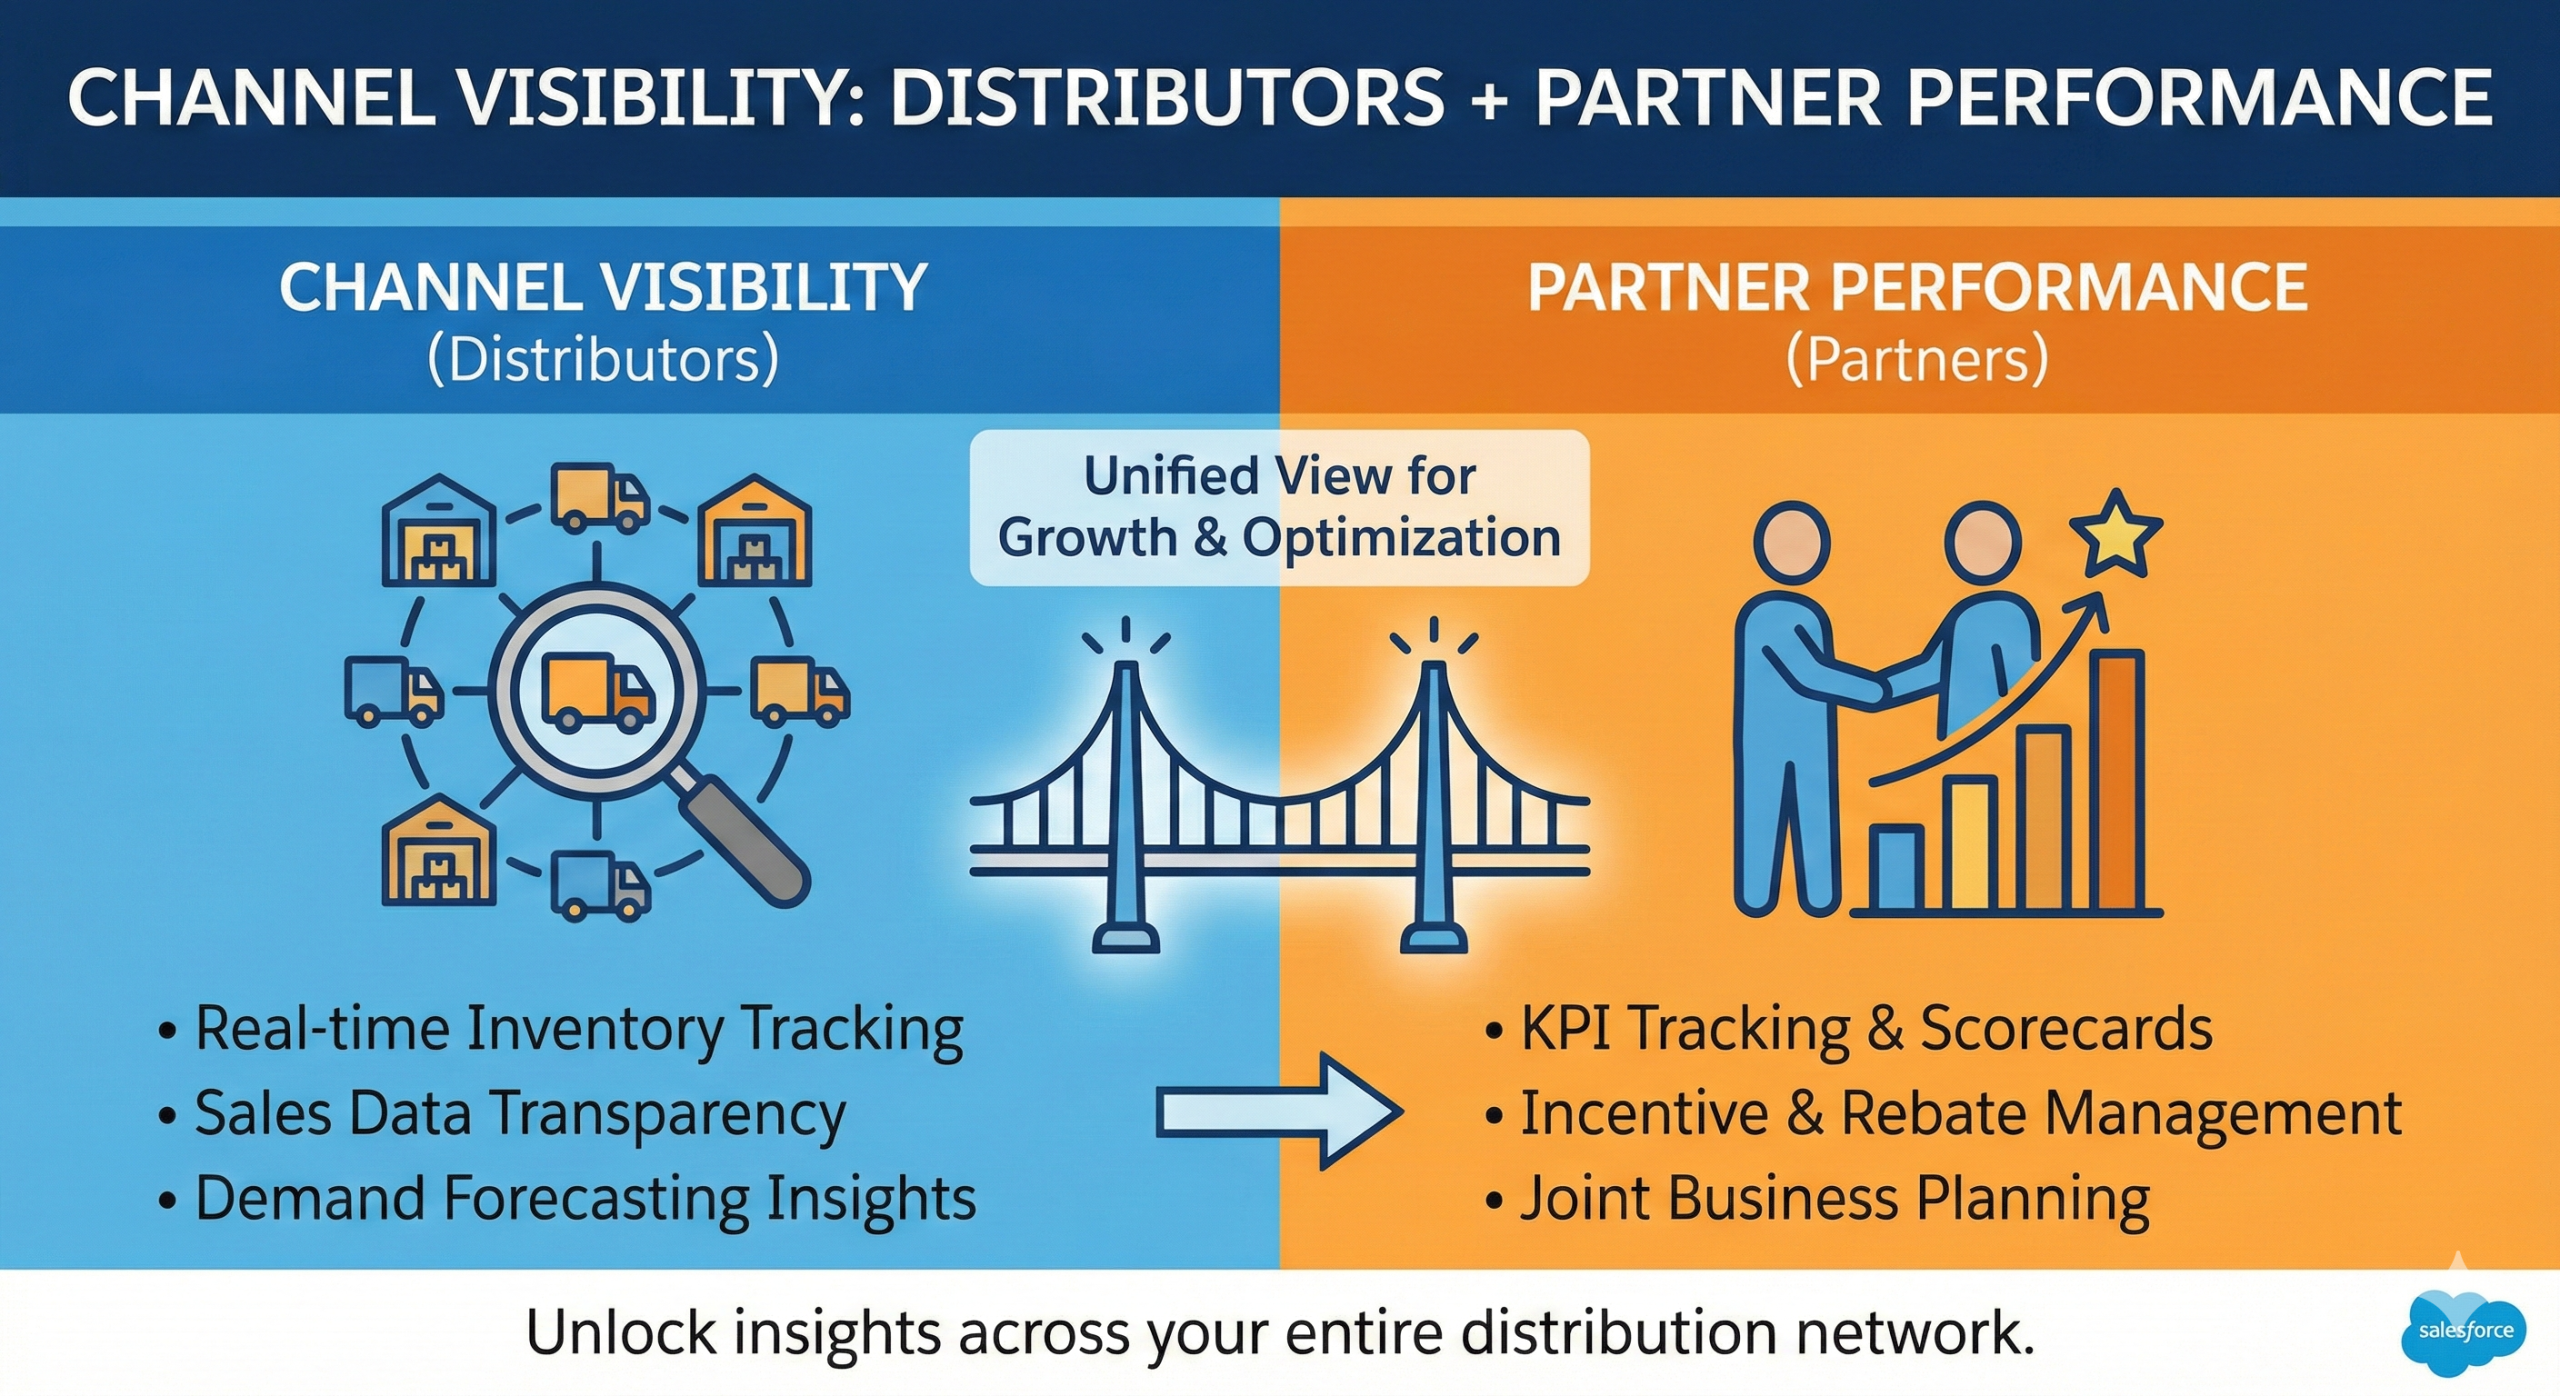
Channel Visibility: Distributors + Partner Performance in Salesforce
Channel visibility in Salesforce means creating a consistent view of distributor and partner performance across sell-in (shipments/orders into the channel), sell-through (POS or consumption), and partner activity (pipeline, deal registration, MDF, enablement). The goal is one dashboard set that helps sales, channel managers, and ops spot gaps, act on exceptions, and forecast more accurately.
This matters most for manufacturers selling through distributors, resellers, or reps where performance is driven by account commitments, inventory, and partner execution—not just direct opportunities.
If you only measure channel performance with “sell-in” → then you can over-ship and miss real demand signals.
If you don’t map partner hierarchies and accounts → then rollups and comparisons are unreliable.
If you don’t define KPIs and cadence → then channel dashboards become interesting—but not operational.
A “good” channel visibility program includes:
A data model that separates partners, end customers, and transactions
System-of-record decisions for sell-in and sell-through
A small KPI set (coverage, velocity, compliance, and growth)
Exception workflows (inventory risk, forecast gaps, MDF delays)
Governed dashboards and metric definitions
Step 1: Define the Three Views of Channel Truth (Sell-In, Sell-Through, and Activity)
Most channel confusion comes from mixing these.
1) Sell-in (what you shipped/sold to the channel)
Manufacturer → distributor orders/shipments
2) Sell-through (what the channel sold to end customers)
Distributor POS, consumption, or downstream invoices
3) Partner activity (what partners are doing to drive demand)
Pipeline, deal regs, lead follow-up, MDF, enablement
Decision logic
If sell-in is up but sell-through is flat → inventory is building and demand may be weaker than it looks.
If sell-through is up but sell-in is down → channel may be drawing down inventory (potential supply risk).
If activity is high but results are low → enablement or deal quality issues may exist.
Step 2: Build the Channel Data Model (Partners, Customers, Products, and Time)
Channel visibility breaks when entities aren’t clearly defined.
What you do
Define entities and relationships:
Partner account (distributor/reseller)
End customer account (where demand occurs)
Products/SKUs and product families
Time buckets (monthly is a strong starting point)
Define hierarchies:
Distributor → region/branch
Partner tiers (Gold/Silver/etc.)
End-customer rollups (parent/child, ship-to/sold-to)
Outputs you want
A channel hierarchy map
A “partner ↔ end customer” linkage approach (how you attribute demand)
Quick win
Start with one distributor and one region to validate hierarchy and rollups.
Step 3: Decide System of Record and Integration Scope (What’s “Actual” in Channel?)
Channel analytics gets stuck when “actual” is undefined.
What you do
Choose sources for:
Sell-in actuals (ERP orders/shipments)
Sell-through actuals (POS feeds, distributor reports)
Inventory (if available)
MDF and deal regs (Salesforce partner processes, if used)
Define refresh frequency:
Weekly/monthly for POS is common
Daily for sell-in shipments may be possible
Outputs you want
System-of-record matrix (domain → system → owner)
Minimum viable integration plan (v1 sources only)
Step 4: Pick the KPIs That Drive Decisions (Not Vanity Metrics)
A good KPI set is small, repeatable, and actionable.
Core channel KPIs (v1)
Performance
Sell-in revenue/units (trend)
Sell-through revenue/units (trend)
Growth rate vs prior period (by partner)
Coverage and health
Channel pipeline coverage (by partner/region)
Active partner count (partners selling in last X days)
Concentration risk (top partners share)
Efficiency
Inventory coverage (if available) or proxy using sell-through velocity
Time-to-approve deal regs (if applicable)
MDF cycle time (submit → approve → proof → reimburse)
Enablement
Onboarding completion rate
Certification completion (if tracked)
Portal adoption (if partner portal exists)
Decision logic
If partner growth is down and enablement is low → focus on onboarding and field enablement.
If sell-in is up but inventory coverage is rising → manage supply and promos carefully.
If MDF cycle time is slow → fix approvals and required fields (not “more MDF”).
Step 5: Build Three Dashboards First (Then Expand)
Start with dashboards that match channel manager workflows.
Dashboard 1: Channel Executive Scorecard
Sell-in vs sell-through trend
Top partners by growth and decline
Coverage and concentration risk
Exceptions (inventory, volatility, MDF delays)
Dashboard 2: Partner Performance Drill-Down
Partner → region/branch → end customer
Product family mix
Growth and velocity trends
Pipeline and deal reg performance (if used)
Dashboard 3: Exceptions + Actions Board
Partners at risk (declining sell-through)
Inventory risk signals
MDF stuck in “needs info” or pending approval
Follow-up SLAs for leads/deal regs
Outputs you want
A certified dashboard set used in weekly/monthly channel reviews
One click from KPI → list of partners/accounts to act on
Step 6: Operationalize With a Cadence (So It Drives Action)
Dashboards matter only when meetings run on them.
What you do
Weekly: exception review (at-risk partners, stuck approvals, big swings)
Monthly: partner performance review (growth, mix, coverage)
Quarterly: tier review and business planning (targets, enablement, MDF strategy)
Outputs you want
A meeting agenda linked to dashboard sections
Owners for each exception category (channel ops, finance, supply, marketing)
Step 7: Governance and Definitions (Prevent “Which Number Is Right?”)
Channel reporting fails when teams calculate sell-through differently.
What you do
Lock definitions for:
Sell-in (booked vs shipped)
Sell-through (POS definition, returns handling)
Time windows and fiscal rules
Attribution rules (which partner gets credit for which customer)
Product mapping (SKU → family; UOM conversions)
Outputs you want
KPI dictionary and change control process
A reconciliation method for POS vs ERP vs finance
Step 8: Make It Usable for Channel Teams (Embedded Views + Next Actions)
Channel managers need “what to do,” not just charts.
What you do
Provide filtered partner lists for action:
“Partners declining 3 months in a row”
“MDF approvals pending > X days”
“Deal regs needing info”
Embed key views where channel teams work (Salesforce record pages or PRM/portal pages)
Create playbooks by scenario:
“Partner decline”
“Inventory build”
“High MDF, low results”
“Low adoption of onboarding”
Outputs you want
Action lists tied to dashboard exceptions
A simple playbook library for channel managers
Common Pitfalls (And How to Avoid Them)
Pitfall: Measuring only sell-in and calling it “demand”
Fix: Add sell-through (POS) or a proxy and compare trends.
Pitfall: Partner hierarchies are messy
Fix: Start with a golden set and validate rollups before scaling.
Pitfall: POS feeds don’t reconcile
Fix: Define return rules, timing lags, and reconciliation cadence.
Pitfall: Too many KPIs
Fix: Use 10–15 KPIs max in the scorecard; drill down for detail.
Pitfall: Dashboards don’t lead to action
Fix: Build an exceptions board and assign owners + next steps.
Frequently Asked Questions
What’s the difference between sell-in and sell-through?
Sell-in is what manufacturers sell or ship to distributors. Sell-through is what the distributor sells to end customers (POS/consumption).
Do we need POS data for channel visibility?
It’s ideal, but not always available. If you don’t have POS, use proxies like distributor inventory and order velocity, then improve over time.
How do we attribute end-customer demand to the right partner?
Define a consistent attribution rule (sold-to, ship-to, branch, territory) and document it. Changing attribution later causes metric drift.
What KPIs should channel leaders review weekly?
Exceptions: partners declining, big swings, approvals stuck, inventory risk, and pipeline gaps.
How do we avoid KPI debates?
Lock definitions and computation paths (sell-in/sell-through rules, returns handling, time windows) and use certified dashboards.
Book a Channel Visibility Working Session
If you want reliable distributor and partner performance reporting (and a dashboard set your channel team actually uses), book time with our team. We’ll map your sell-in vs sell-through model, define the first KPI scorecard, and outline an MVP dashboard + exception workflow, so you get visibility quickly without metric chaos.