
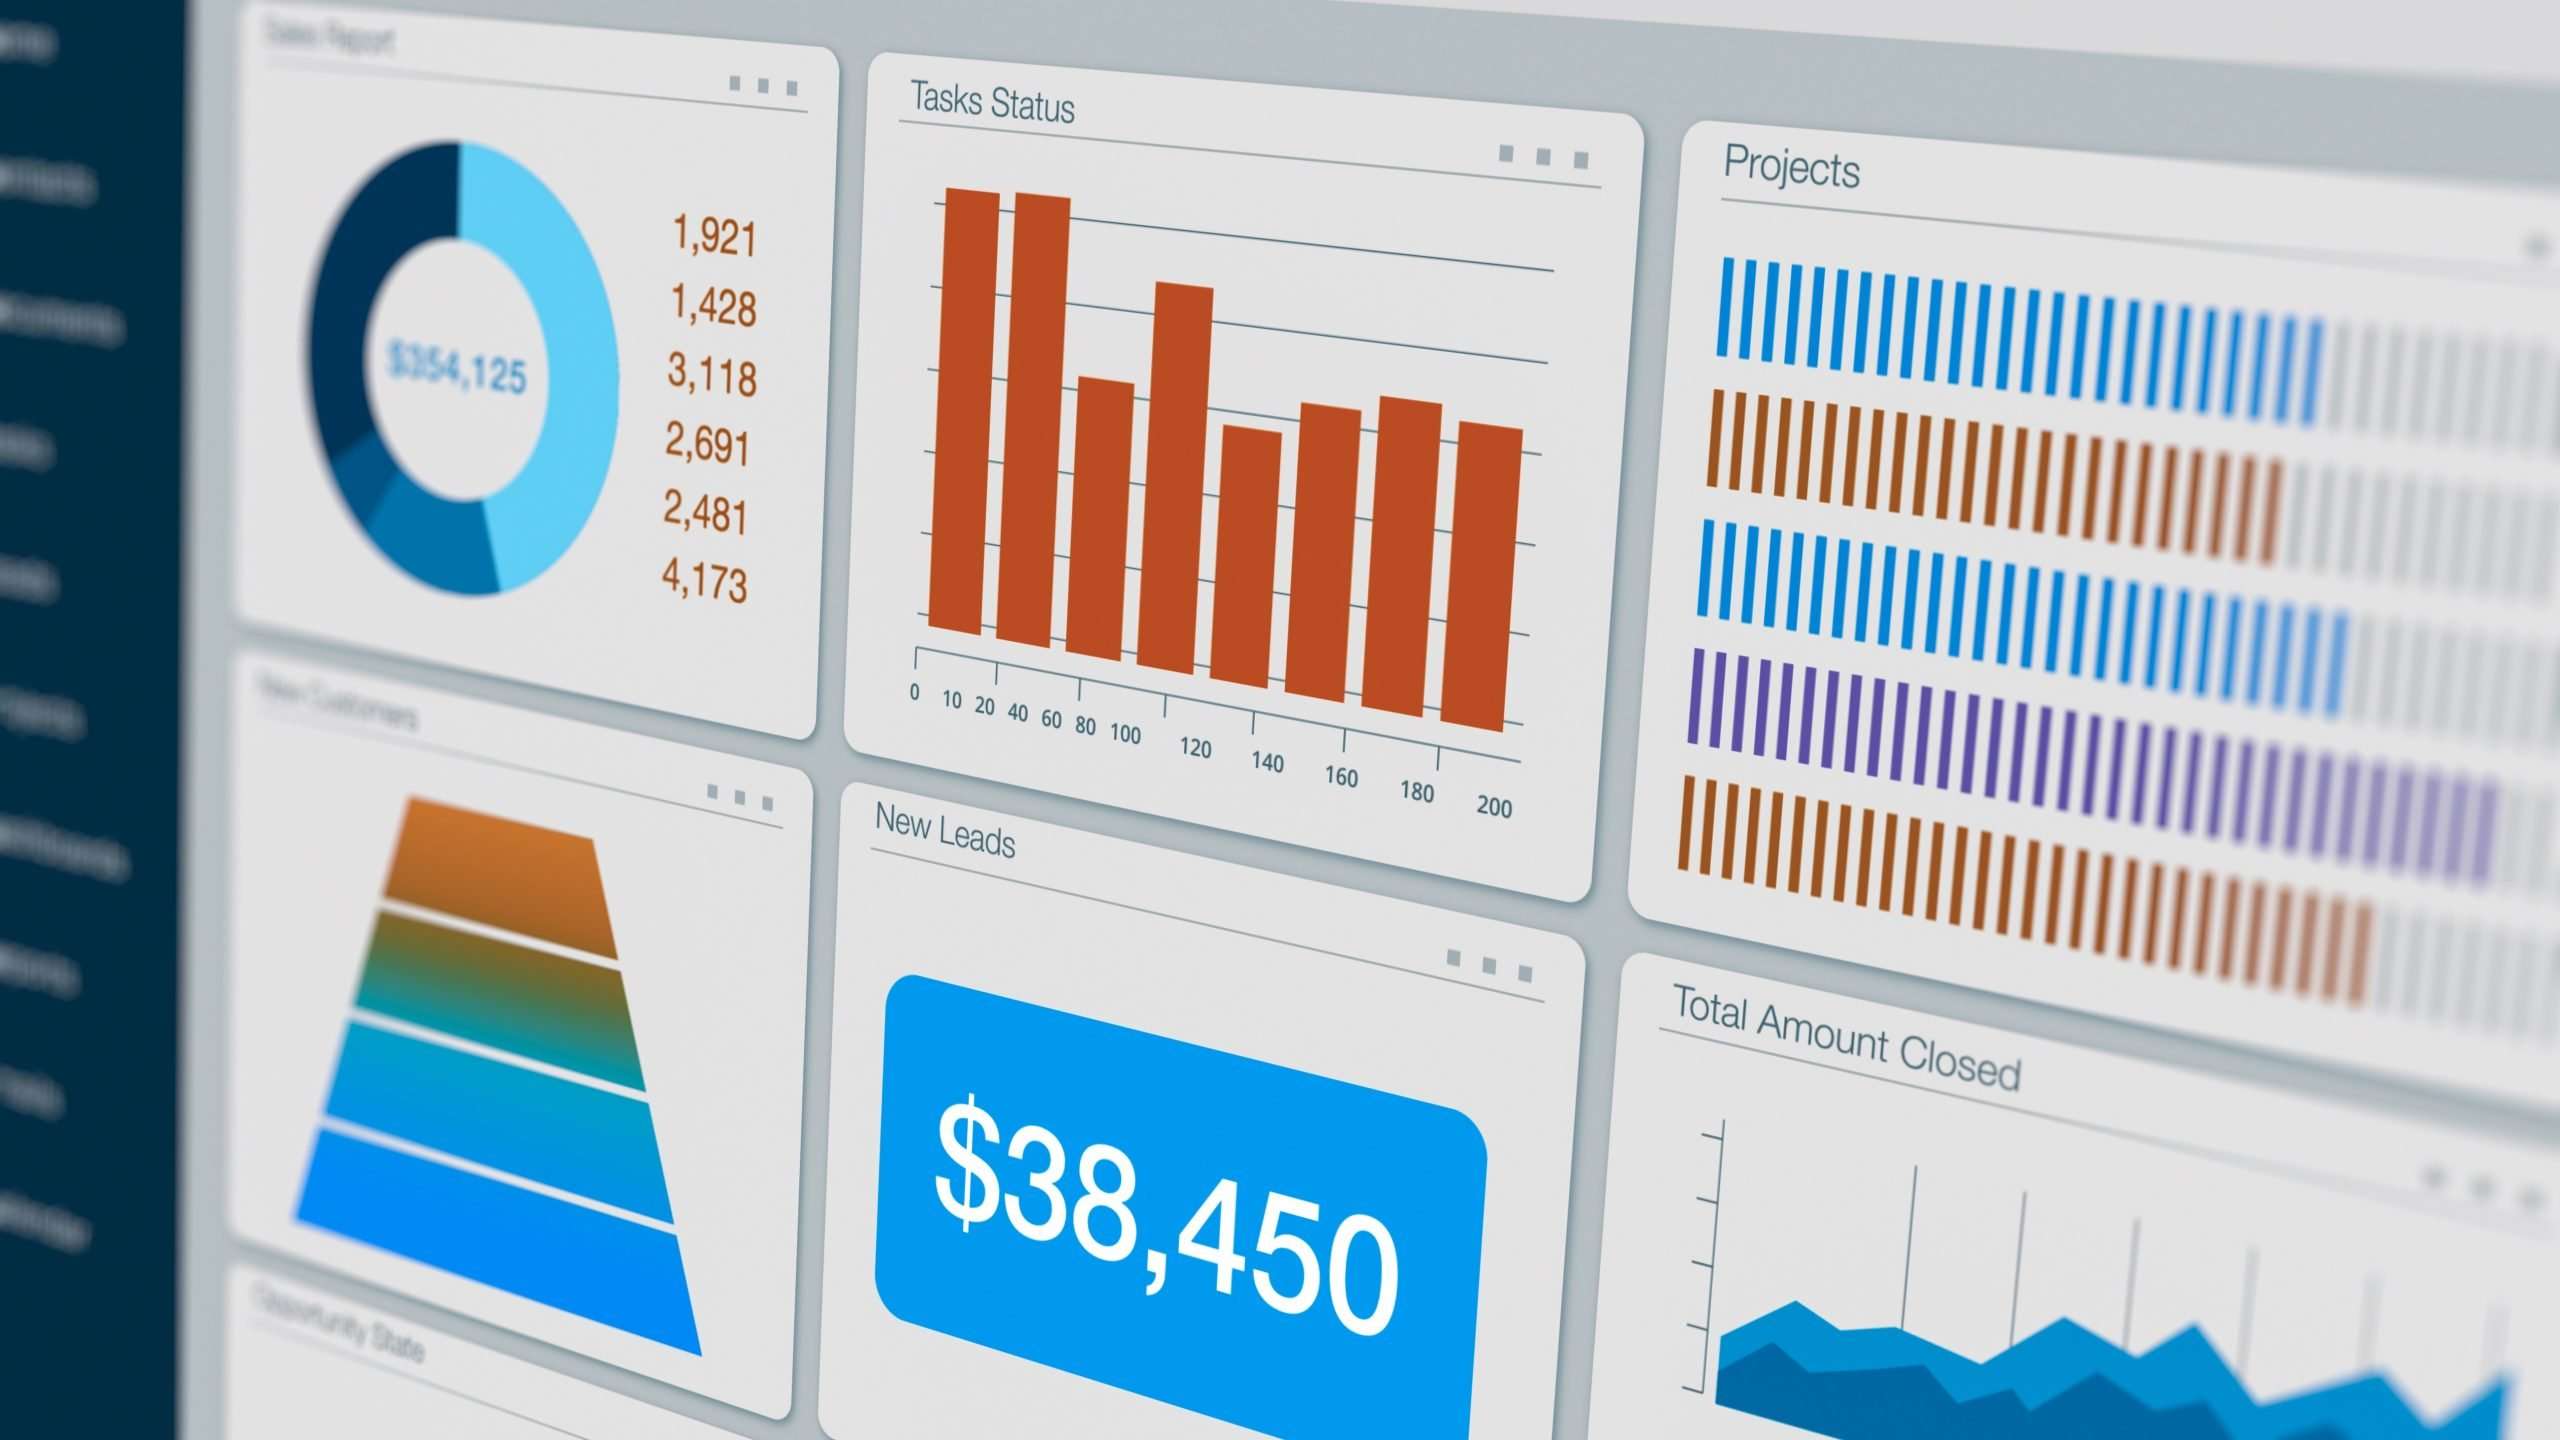
Dashboards that Matter: Tracking AUM & Pipeline in HubSpot
You Can’t Manage What You Can’t See
In financial services, visibility drives performance.
Whether you’re tracking assets under management (AUM), monitoring pipeline health, or coaching advisors, your ability to make smart decisions depends on having the right data, at the right time, in the right format.
Too often, that data is buried in spreadsheets, disconnected tools, or siloed systems. Reports are slow, manual, and inconsistent across teams. Leadership meetings turn into status updates instead of strategic discussions.
That’s why more RIAs and broker-dealers are turning to HubSpot’s financial dashboards, to centralize reporting, uncover insights, and create accountability across sales, service, and operations.
In this post, we’ll show you how financial services firms can use HubSpot to track what actually matters, without relying on custom development or complex BI tools.
What Financial Firms Need from CRM Dashboards
Financial services teams need more than basic sales reporting. Your dashboards should help you:
- Track pipeline value and movement by advisor, team, and business line
- Monitor AUM growth across new clients and upsells
- Identify conversion bottlenecks and lead aging
- Measure activity volume, calls, meetings, emails, and link it to outcomes
- Forecast revenue and onboarding capacity based on live CRM data
If your current dashboards can’t do that, or if you have to export and manipulate spreadsheets every week to get there, you’re missing the full value of your CRM.
Why HubSpot Works for Financial Services Dashboards
HubSpot offers powerful reporting features that make it easy to:
- Build customized dashboards by role (advisor, manager, executive)
- Visualize real-time data on pipeline value, close rate, and deal velocity
- Filter reports by product, advisor, segment, or region
- Combine sales activity with onboarding or service metrics
- Embed dashboards directly into team meetings or performance reviews
Even better? You don’t need a data team to build them. HubSpot’s drag-and-drop reporting tools are designed for business users, not BI specialists.
5 Dashboards Financial Advisors and Leaders Actually Use
Here are five high-impact dashboards financial services firms use in HubSpot to run their business more effectively:
1. Advisor Pipeline Health Dashboard
- Total pipeline value by stage
- Number of deals in each stage
- Average deal size and velocity
- Stalled deals (no activity in X days)
Use case: Helps individual advisors and managers track progress and prioritize follow-up.
2. AUM Growth & Revenue Forecast Dashboard
- AUM added by month, quarter, or advisor
- New client revenue vs. upsell revenue
- Forecasted revenue based on deal close probability
Use case: Supports quarterly business reviews, territory planning, and growth tracking.
3. Lead Conversion & Source Attribution Dashboard
- Lead-to-client conversion rate by source
- Top-performing marketing campaigns or referral channels
- Conversion rates by advisor or service line
Use case: Enables marketing and sales teams to optimize lead flow and targeting.
4. Advisor Activity Dashboard
- Calls, emails, meetings logged per advisor
- Task completion rates
- Activity-to-conversion correlation
Use case: Supports performance coaching and helps identify top producers or coaching opportunities.
5. Onboarding & Service Request Dashboard
- Clients by onboarding stage
- Time to onboard (average, median, outliers)
- Open service tickets by type and status
Use case: Gives operations teams visibility into workload and SLAs.
Best Practices for Setting Up Dashboards in HubSpot
- Start With the Questions You Want to Answer
Before building reports, define what decisions you want to support. For example:
- “Which advisors are generating the most pipeline?”
- “Where are clients getting stuck in onboarding?”
- “How much AUM did we bring in this quarter?”
- Build Dashboards for Specific Roles
Executives need a firmwide view. Advisors want to track their book. Ops leaders need to monitor process bottlenecks. Customize views accordingly. - Keep It Actionable
Don’t clutter dashboards with vanity metrics. Every chart should point to a decision or action. - Refresh Regularly and Review Often
Use dashboards in weekly check-ins, team meetings, and quarterly reviews. Visibility only drives accountability if people are looking at the data consistently. - Layer in Automation
Use HubSpot workflows to trigger tasks or alerts based on dashboard data, e.g., follow-up reminders on stalled deals or escalation for overdue onboarding tasks.
Final Thoughts
Financial services leaders don’t need more data, they need better visibility.
With the right dashboards in HubSpot, you can go from reactive to proactive, from disconnected to aligned, and from scattered spreadsheets to real-time insights.
Your advisors want to perform. Your leaders want to lead. Give them the dashboards that help them do it.
Want Help Building Dashboards That Actually Matter?
Fast Slow Motion helps financial services firms design and build CRM dashboards that support growth, improve team performance, and reduce reporting friction, inside HubSpot.
Explore more CRM content for financial services:
- Why HubSpot Is Winning with RIAs & Broker-Dealers
- Automating Client Onboarding in HubSpot Workflows
- HubSpot + Outlook: Zero-Friction Email & Meeting Capture
- Lock-Tight Security: SOC 2 & GDPR Inside HubSpot CRM
What to Do Next
- Register for our upcoming webinar
- Download our free CRM for Financial Services Checklist (no form fill) to audit what data your team needs most
- Get in touch with our team to see how we can help